TropGeneDB: user interface documentation
|

|
In order to consult data related to a given
species, select it from the "Species" menu-item. You will end-up on
a page containing one or several tabs, depending on the chosen crop. Each tab
contains a different query form, that leads to different types of data.
|

|
GENERALITIES ABOUT QUERY FORMS
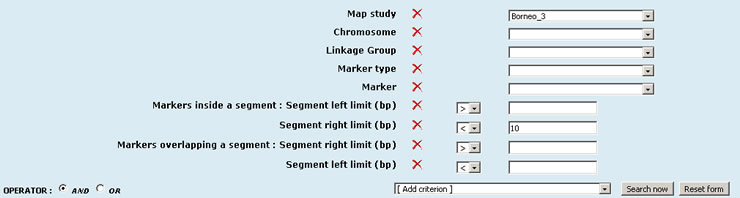
A query form consists of various kinds of filters
represented by standard input widgets. An important point is the ability to
select the operator (AND / OR) applied for grouping together the filters
defined by used widgets.
|
The only situation where both operators can be
combined is when using multiple-choice list-boxes: all items selected within a
box of this type will implicitly be grouped together using the OR operator,
while the default AND operator, if it remains selected in the web form, can
still apply between choices made for each criterion.
|

|
QUERY FORM USAGE TIPS
Some filters have peculiarities, users may want to know about:
|
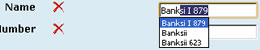
- Some text-boxes have lookup-lists tied to
them. This is particularly useful when a non-trivial, exact string is expected.
|
|
- If you are unfamiliar with multiple-choice
list-boxes you may have trouble selecting most items: just click somewhere in
the box, then type CTRL / A to select all items, keep the CTRL key down and
finally unselect unwanted items by simple mouse-clicks.
- Filters where a red cross lies between the
criterion label and the widget can be removed by clicking on the mentioned
cross icon. Those filters can also be (re-)added, several times if needed,
using the "Add criterion" list-box. Having several identical filters
only makes sense when using the OR operator, because otherwise selecting two
different values for the same criterion would result in an empty dataset.
|
- Filters for which no red cross appears
essentially consist of list-boxes whose contents are subject to a dependency
relationship. This kind of relationship ties list-boxes two by two: the
contents of the second one are automatically updated when selection changes in
the first.
|

|
ABOUT RESULT DATA
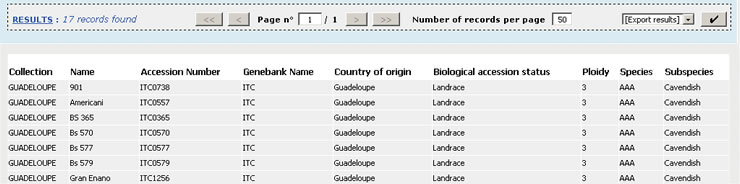
Search results are displayed in tables where
each column represents a relevant attribute (database field). Visualised data
can be sorted by any of those fields by clicking on the column header label.
|

|
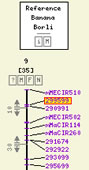
In cases where additional details are available regarding an attribute,
its value is highlighted in orange: when moused over, an extra layer
appears where one or more links can be clicked.
|
|
|
Apart from "detaid sheets" which are internal TropgeneDB pages, such links can also lead to comparative map views (CMAP), or to a downloadable file (typically providing a full genotyping study's data when it is too large to be searched in).
|

Pagination is used for displaying the
results. Apart from being able to move to the first, next, previous or last
page, you can also define the number of records per page, or directly jump to a
page by specifying its index.
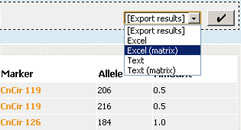
EXPORTING RESULTS
|
At the end of the navigation bar can be found
an "Export results" list box that lets you select an export format:
Excel or Text (csv). Depending on the kind of data that is being dealt with, 2
extra formats may be offered: Excel matrix and Text matrix. Simply select an
output format then click the button next to this box, and data download will
start.
|
|
|